
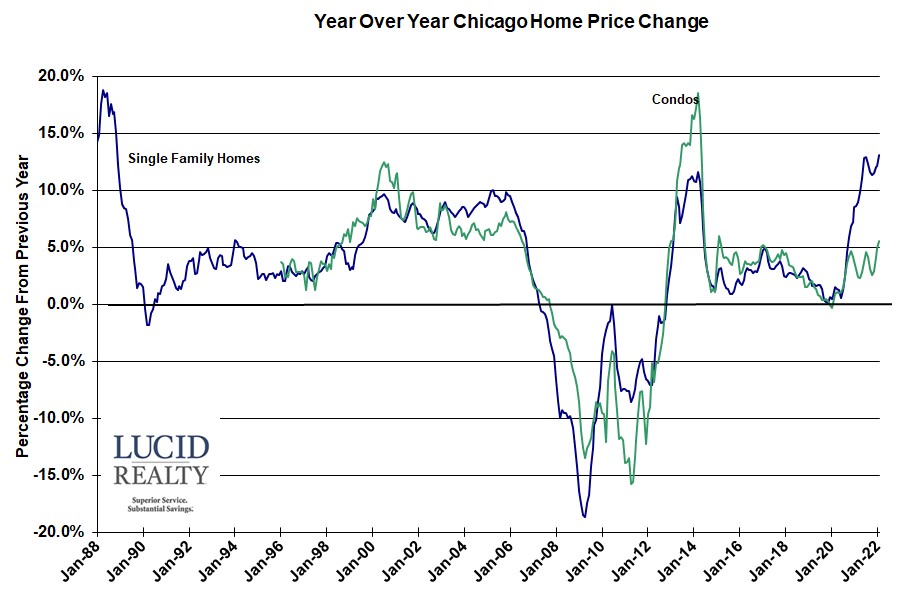
Chicago area single family home prices have shown annual gains for 112 consecutive months.
The National Composite’s 19.8% year-over-year change for February was the third-highest reading in 35 years of history. That level of price growth suggests broad strength in the housing market, which is exactly what we continue to observe. All 20 cities saw double-digit price increases for the 12 months ended in February, and price growth in all 20 cities accelerated relative to January’s report. The macroeconomic environment is evolving rapidly and may not support extraordinary home price growth for much longer. The post-COVID resumption of general economic activity has stoked inflation, and the Federal Reserve has begun to increase interest rates in response. We may soon begin to see the impact of increasing mortgage rates on home prices.
Case Shiller Chicago Area Home Price Index By Month
The graph below shows the Case Shiller index values for the Chicago area by month along with a red trendline based on single family prices before the bubble developed. Single family home prices rose by 1.2% from January, surpassing the bubble peak level by 3.9%. Condo/ townhome prices rose 0.2% but that still leaves them 0.4% below their peak. Notice how over the last few months single family home prices have really pulled ahead of condo prices. Relative to their trendline single family home prices are still lagging by 19.4% but let’s keep things in perspective. Single family home prices are now up a total of 70.5% from the bottom of the market while condo prices have risen 64.8%.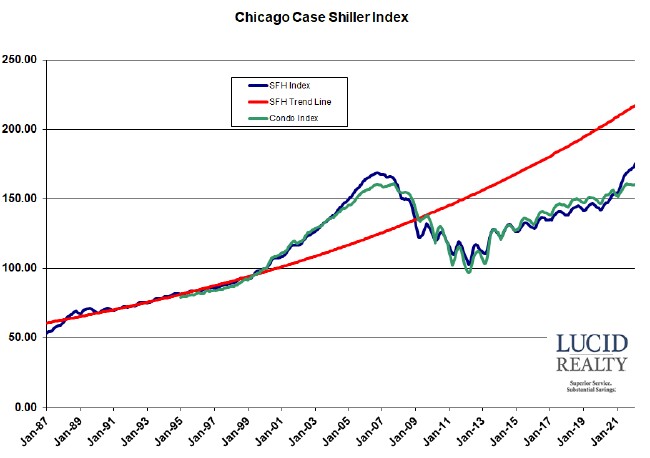
The Chicago area real estate market finally surpassed bubble peak prices in August.







Leave A Comment
You must be logged in to post a comment.