
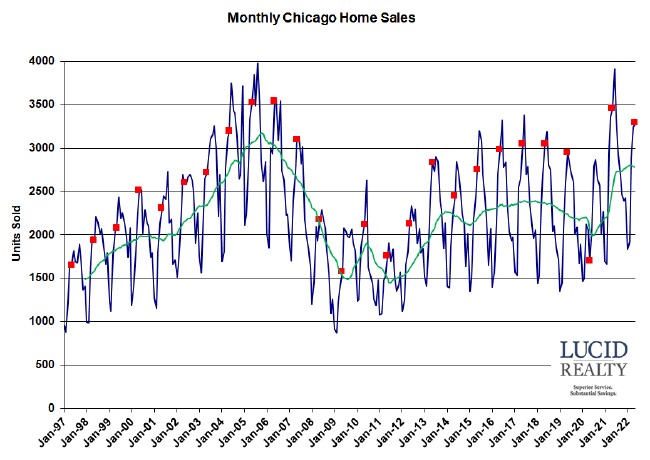
Chicago home sales had been declining now for several years but the Coronavirus really tanked the market in May and June of 2020. The market returned to more normal levels starting in July 2020 and is now at near record levels.
Chicago Home Contract Activity
However, the rest of the story is in the contract activity, which is starting to show signs of weakness and it’s a leading indicator of sales, right? May was the third month in a row of fairly significant and increasing declines in contracts written. You can see it clearly in the moving average line in the graph below. May contracts were down 18.6% from last year and only up slightly from the 2019 level. You would think that eventually this would show up in lower sales figures.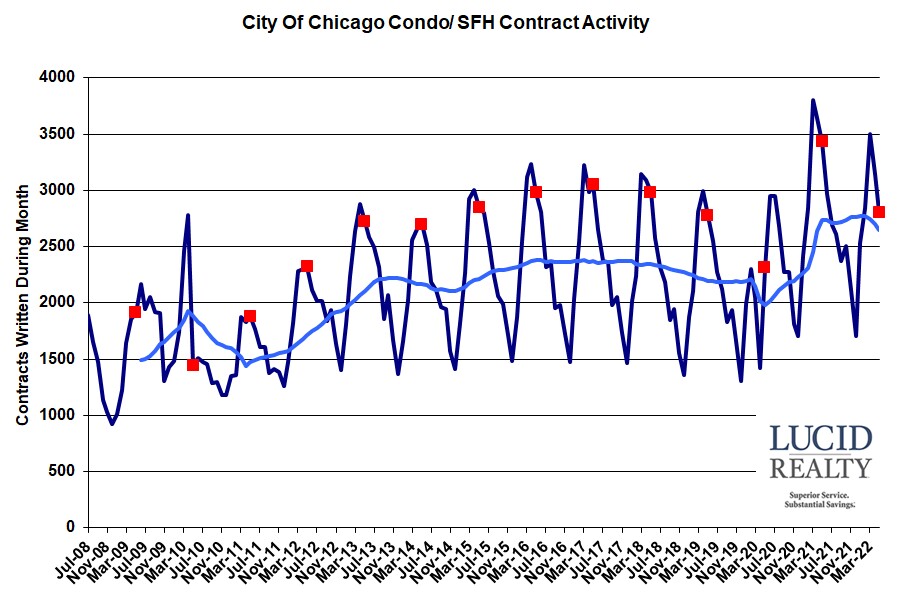
Chicago home sale contract activity is still at the high end of the historic range
Pending Chicago Home Sales
What’s been keeping the lower contract figures from translating into lower sales is a backlog of pending sales which has been drawing down for about a year now. You can see that in the graph below – check out the moving average line. May’s pending home sales were down 1455 units from the previous year and 328 units from April. That’s pretty significant when you consider that May sales were 3291 units. But there are limits to how much more we can go to the “well” for additional sales.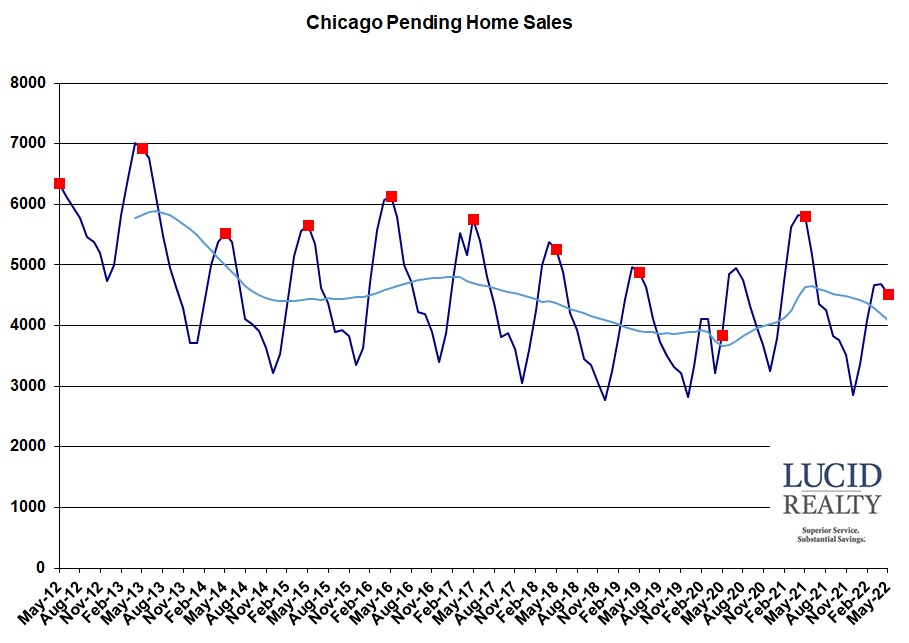
After hitting historic lows the backlog of homes likely to close in the next 1 – 2 months rebounded during the pandemic but is now starting to retreat again
Distressed Chicago Home Sales
I’ve been talking about how foreclosure activity has been fairly muted since the expiration of the foreclosure moratorium so it’s no surprise that the percentage of distressed sales remains pretty low. However, it has been ticking up slightly lately. May came in with only 2.2% distressed sales compared to an even lower 1.1% last year. You can see the trend in the graph below. But I don’t think the percentage is going to go much higher, given the low level of foreclosure activity.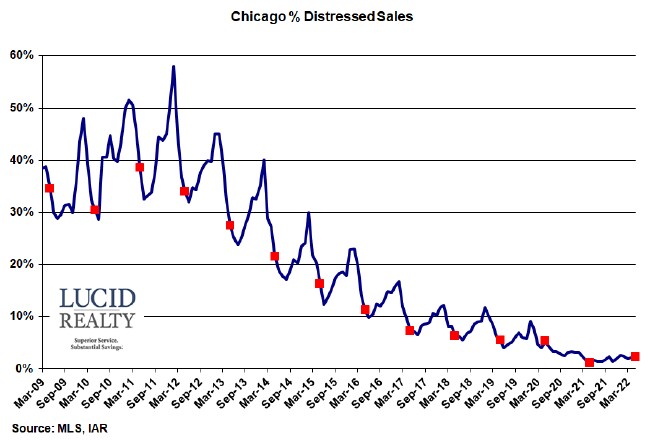
Since the housing crisis the percentage of home sales that are distressed has steadily declined to almost negligible levels.
Chicago Home Inventory
The strength of the market can be measured by the supply/ demand imbalance as summed up in the months of supply. Both detached and attached homes keep hitting new lows. Detached inventory was the same as last year with a 1.9 month supply while attached inventory fell to 2.3 months vs. 2.8 last year. Just glancing at the graph you can see how 5 months was a more typical number once we got past the housing crash and that is generally seen as a more balanced market.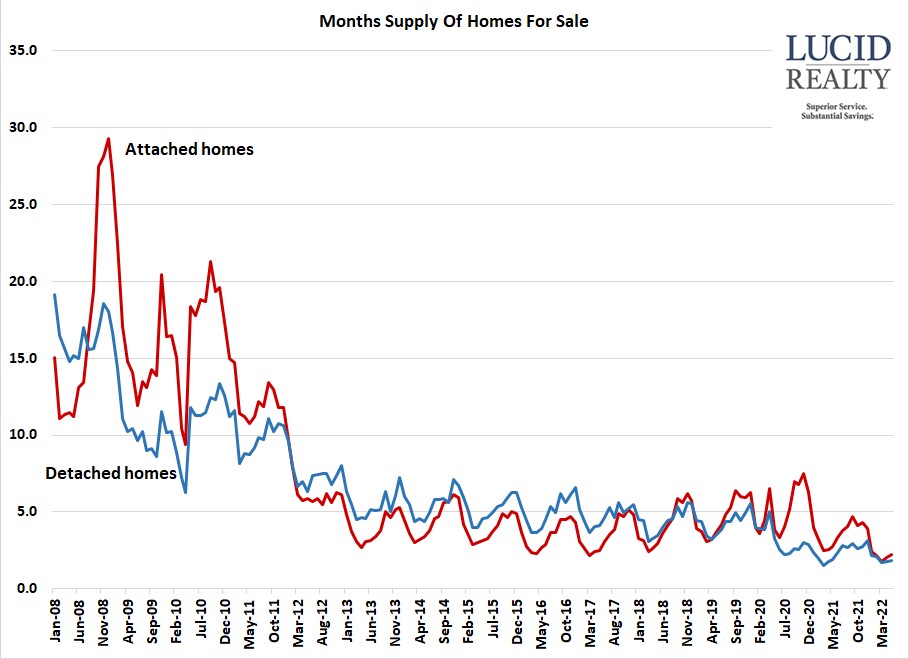
After a big Coronavirus induced spike in April 2020 the inventory of homes for sale dropped back down. Both detached and attached inventory keep setting new record lows.
Chicago Home Sale Market Times
How long it takes to sell a home is also a great indicator of the strength of a market and again we’re seeing some positive signs. Attached market times are fairly low at 59 days on average – down from 81 days last year – but, as you can see in the graph, that’s not a record. On the other hand detached market times of 46 days is a record low and that is down from 50 days last year.When the pandemic first hit Chicago market times rose but they quickly recovered and are now hitting record lows.








Leave A Comment
You must be logged in to post a comment.