
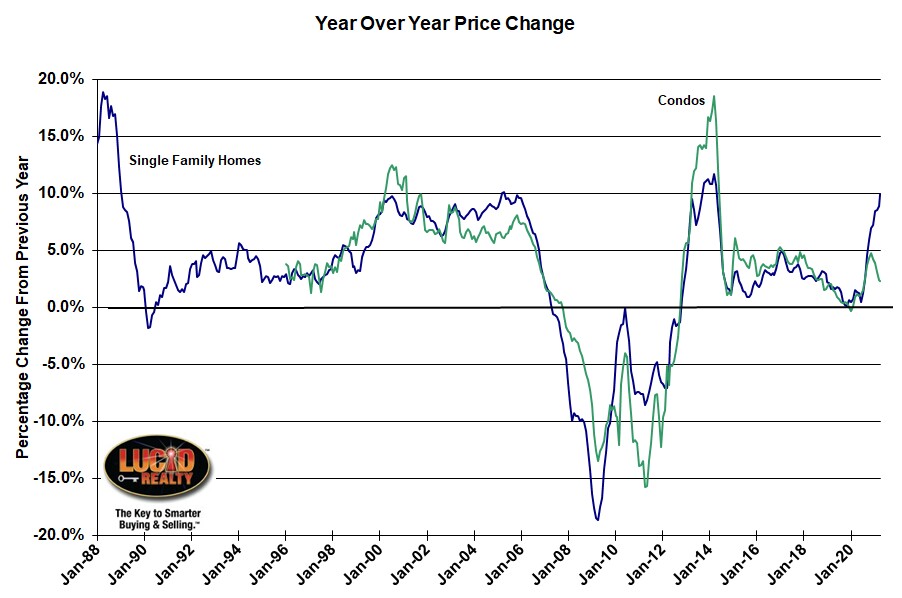
Chicago area single family home prices have shown annual gains for 102 consecutive months
April’s performance was truly extraordinary. The 14.6% gain in the National Composite is literally the highest reading in more than 30 years of S&P CoreLogic Case-Shiller data. Housing prices in all 20 cities rose; price gains in all 20 cities accelerated; price gains in all 20 cities were in the top quartile of historical performance. In 15 cities, price gains were in top decile. Five cities –Charlotte,Cleveland,Dallas,Denver, andSeattle– joined the National Composite in recording their all-time highest 12-month gains. We have previously suggested that the strength in the U.S. housing market is being driven in part by reaction to the COVID pandemic, as potential buyers move from urban apartments to suburban homes. April’s data continue to be consistent with this hypothesis. This demand surge may simply represent an acceleration of purchases that would have occurred anyway over the next several years. Alternatively, there may have been a secular change in locational preferences, leading to a permanent shift in the demand curve for housing…I bolded that one sentence above because I wanted to highlight the fact that, while the Chicago area hits a 7 year high in home price appreciation, the rest of the country is hitting a 30 year high.
Case Shiller Chicago Area Home Price Index By Month
The monthly indices are graphed below going back to 1987 and I’ve also added a red trend line which was based upon single family home price appreciation before the housing bubble screwed things up. April single family home prices rose by 1.9% from March while condo prices rose 1.1%. We’re definitely getting within spitting distance of the bubble peak, the Chicago area being one of the few metro areas that hasn’t reached it yet (actually I haven’t checked lately and it’s possible we are now the only one). Single family home prices are 4.9% short and condo prices are 3.6% short. But that means that, on average, people who bought a single family home from October 2005 – December 2007 are underwater and condo owners who bought between November 2005 – February 2008 are underwater. The gap with the red trend line is much more pronounced of course. We are falling short by 24.0%. Perhaps a more positive picture emerges when we look at how far we’ve recovered from the bottom of the housing market crash. Single family homes prices have risen 56.0% while condo prices have gained 59.5%.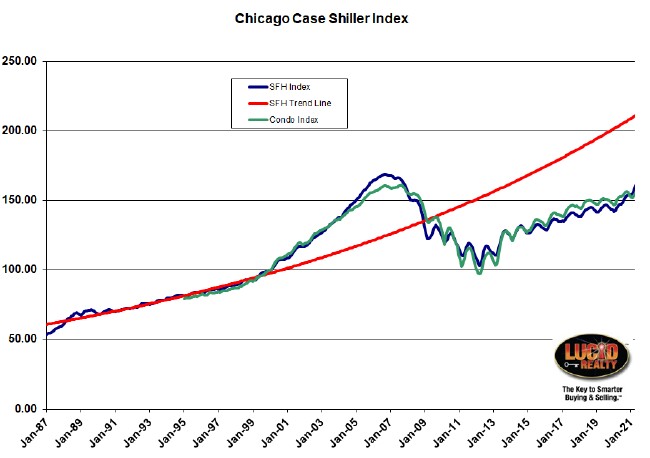
The Chicago real estate market still has a long way to go before catching up to bubble peak prices.








Leave A Comment
You must be logged in to post a comment.