
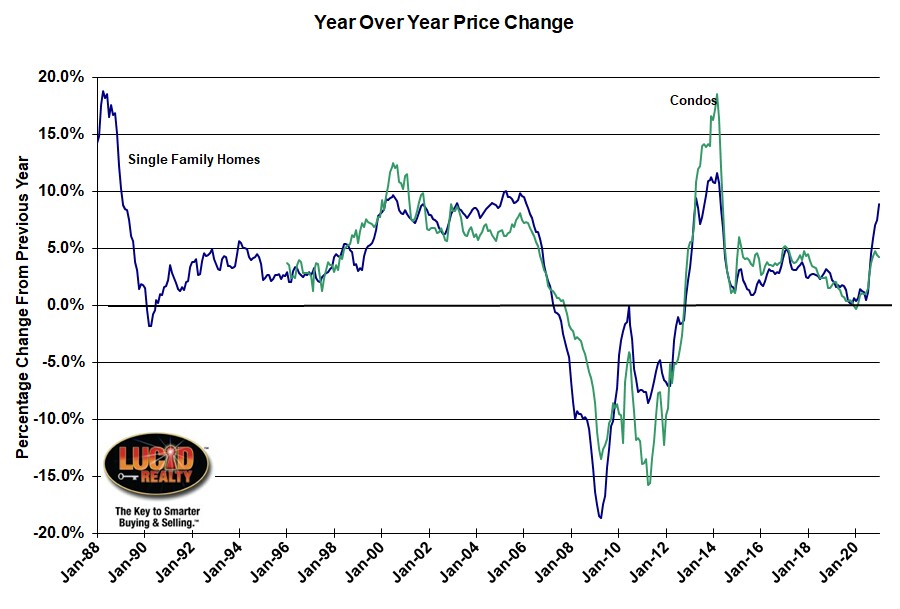
Chicago area single family home prices have shown annual gains for 99 consecutive months
The market’s strength is broadly-based: all 20 cities rose, and all 20 cities gained more in the 12 months ended in January 2021 than they had gained in the 12 months ended in December 2020. January’s performance is particularly impressive in historical context. The National Composite’s 11.2% gain is the highest recorded since February 2006, just one month shy of 15 years ago. In more than 30 years of S&P CoreLogic Case-Shiller data, January’s year-over-year change is comfortably in the top decile… January’s data remain consistent with the view that COVID has encouraged potential buyers to move from urban apartments to suburban homes. This demand may represent buyers who accelerated purchases that would have happened anyway over the next several years. Alternatively, there may have been a secular change in preferences, leading to a shift in the demand curve for housing. Future data will be required to analyze this question. Phoenix’s 15.8% increase led all cities for the 20th consecutive month, with Seattle (+14.3%) and San Diego (+14.2%) close behind. Although prices were strongest in the West (+11.7%), gains were impressive in every region.
Case Shiller Chicago Area Home Price Index By Month
The graph below puts all the underlying Chicago Case Shiller indices in historic perspective along with a red trend line for single family homes based on the pre-bubble times. In January single family home prices rose 0.5% from December while condo prices dropped 0.6%. But you can plainly see how home prices are still below the bubble peak levels with single family prices off by 8.1% and condo prices off by 4.9%. That leaves a lot of people still underwater from where they bought. For instance, the average person who purchased a single family home between May 2005 and February 2008 is still underwater as is the average person who bought a condo between September 2005 and September 2008 – basically a 3 year period of higher prices than now. Also, if you compare where we are today to that red trend line you’ll see that we are trailing it by 25.9% which is even more depressing. What could have been! Of course, we’ve made great strides since the absolute bottom. Single family home prices have risen by 50.7% and condo prices have risen by 57.3%.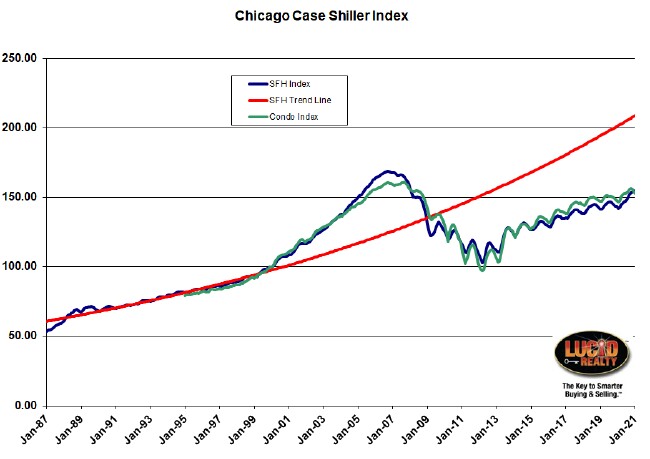
The Chicago real estate market still has a long way to go before catching up to bubble peak prices.








Leave A Comment
You must be logged in to post a comment.