
On Thursday in a CribChatter post on real estate market conditions I made a series of comments to the effect that densely populated urban areas were losing their appeal to the masses as evidenced by recent population growth trends. Well that sure set off a firestorm of debate – actually it was a pretty one sided debate with me standing alone by my thesis. However, that’s to be expected on a blog where most of the participants have made the decision to live in a city.
As someone who is very close to becoming a property owner in Chicago, I’m actually rather obsessed with the question of where people want to live. So, since Thursday, I’ve been poking around in the data some more to figure out if I could get a clearer picture of what the population growth trend in the US looks like. I created a heat map of the population growth, measured by percentage increase from 2000 – 2010, by Metropolitan Statistical Area (a little bit less than 185 of them). You can see it below and if you click on it you can see a larger version of the map. The range goes from -15% (white) to +45% (dark green).
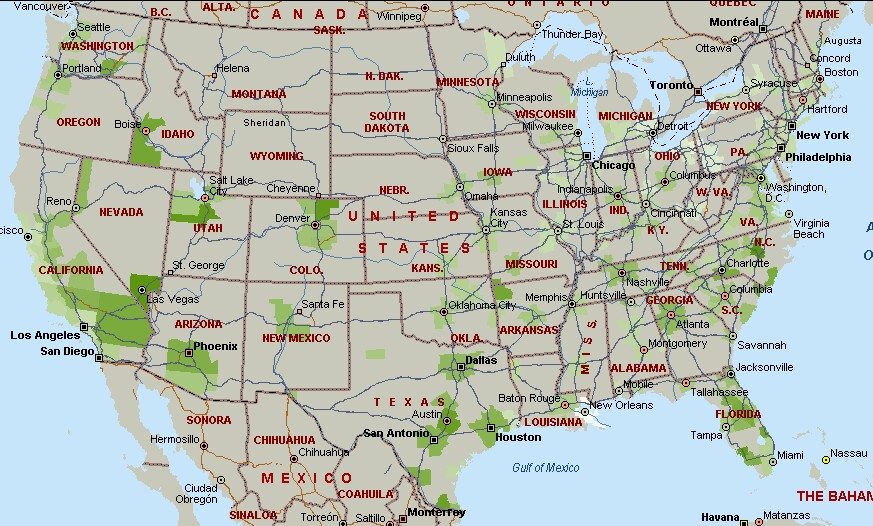
As I am sure has been covered by many others before, you can see that the population is either not growing or declining in the northeast and the Midwest and growing in the south and west. To me it looks like it is shifting from colder, more densely populated, and less business friendly environments.
Now one could write a graduate thesis on this topic using multivariate regression analysis to really determine the impact that population density has on population shifts but I don’t have the time or the inclination to do that. However, I did do a rather simplistic analysis sorting the metro areas by density and it sure looks to me like people are favoring the less densely populated cities. In the graph below I split the metro areas into 3 buckets based upon density and then calculated the average growth rate between 2000 and 2010 for the metro areas in those buckets. The high density bucket contains the 10 largest metro areas, the medium density bucket contains the next 17, and the lowest density bucket contains 151.
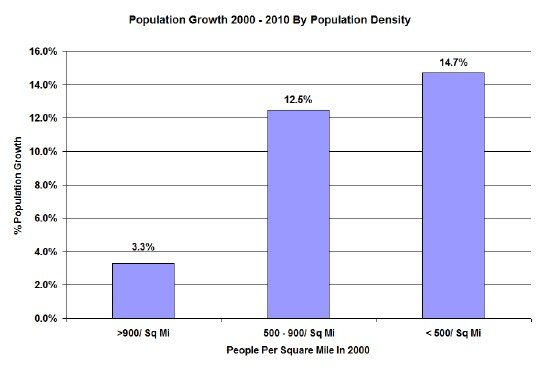
As you can see the highest density metro areas grew only 3.3% on average during the decade. That bucket contains Chicago and the surrounding area, which had a population density of 987 people/ square mile in 2000 and only grew by 4% during the decade. My conclusion is that there is a limit to the extent to which people are willing to be stacked up on top of each other.
Do People Really Want To Live In Cities?
Share This Story, Choose Your Platform!
Related Posts

No Comments
Leave A Comment
You must be logged in to post a comment.
I’ve wondered about these patterns as well. A few points that have come to mind:
1. Yes, we’re moving away from cold winters (except for the few that want to spend winter close to ski slopes, see Front Range Colorado and Salt Lake City). Since we started expanding the national infrastructure to equalize industrial-scale access across the landscape, we’ve been running an experiment: if people with economic options can live in any region of North America, where will they go? So far, the answers are “coasts that avoid severe winters.” The East coast has held its own while the West and South coasts grow; the North coast (Great Lakes) has tended to slowly shrink. I think this trend could keep running until all three coasts equalize in density; as they start to fill in (and each region starts to find and deal with their resource limits), we’ll have to see what preferences then kick in. One potential is to see British Columbia and southern Alaska become the next growth region; the climate’s not that different from Washington/ Oregon, and oil/gas/minerals development in the northern Rockies could feed the growth of some of the ports. Of course, much of that depends on Canadian political tendencies. This is a pattern based strictly on regional competitiveness; zoom in from whole regions to smaller scales, and I think other factors can be noticed.
2. Since WW2, US policy has overwhelmingly favored suburban-scale development. Transportation has considered personal autos and airlines to be the default mode for passenger travel, to the point most post-WW2 neighborhoods don’t even have sidewalks. You’re expected to walk only as far as the driveway before climbing into a car for 99.99 per cent of your trips. Model zoning laws and building codes often prefer forcing developers to use larger lots, in part to force new houses to be affordable only to middle class families — frankly, too much affordable housing will bring in the riff-raff with too many kids to clog the schools and not enough wages to pay property taxes to pull their weight. Do you really want a house or lot this size? Unless you had your house custom-built, your house’s development was built by a developer who had to get approval from a set of politicians who were elected by incumbent voters who didn’t vote those pols in so they could approve houses for new neighbors poorer than they were. That’s the micropolitical urge that economic realities of housing affordability and employment have had to fight against with every local election. Keep in mind that once the lot-lines and foundations are in place, that’s the framework that population density will deal with for the next couple of generations, at minimum. Granted, many, maybe most people have been happy or at least willing to go along; but anyone looking for higher density options has definitely been looking for an “alternative” not supported by most local or national policies.
I tend to look at urban/ pedestrian (as opposed to suburban — automobile-oriented, lower density) neighborhoods as something we’ve seen go through three stages: first, denigration as “congestion”, for which suburban development was the cure; then, the official attempt at resuscitating central cities once the paying population had been sucked out of them, which was termed “urban renewal”. This seems to have been attempted by “planners” who were not only fighting against the tide of continuing suburban outflow, but people who had little idea what was necessary and who had even less stake in the outcome. The planners for urban renewal weren’t necessarily moving back into the cities themselves (compare with politicians who don’t send their kids to public schools — familiar?).
The third wave was the beginning of “gentrification”. Usually this starts with unapproved, unofficial, even unwanted settlement of central city neighborhoods by artsy, younger adults, often just graduated from college and looking for places close to work downtown, or with sufficient inattention from “authorities” to ignore their attempts to work out a “lifestyle” their suburban birthplaces wouldn’t put up with. Miraculously, if they reached economic maturity and demographic critical mass before arousing sufficient attention, they may create just the sort of dense, urban culture a lot of suburban folks don’t mind visiting, even if they’re still terrified of the idea of actually living there. This is borne out, not just by actual tourism to such cities and neighborhoods, but the attempts to ape the microgeography and antics of the diverse urb/ped city in malls and Disney World.
The point is, our actual successes at creating workable urban-density neighborhoods and cities has happened in spite of national policy, not because of it. We’ve had occasional glances in the direction of building an urban America we could not only be proud of, but prefer; but then we always go back to the serious business of building bigger houses on bigger lots, requiring bigger cars on bigger roads to cruise between them. Our best urban neighborhoods are most often rebuilds of older, pre-WW2 neighborhoods, in cities old enough to have some. More to the point, while they may be well integrated into their local downtown (a basic survival strategy), they typically aren’t well integrated to one another. With the exception of the East Coast and its rail service, residents in pedestrian/ urban neighborhoods have to leave their natural habitat to get to the airport if they want to get to another city and its urban neighborhoods. And this has been the reality long enough that most American suburbanites truly have no clue of any other way of life. All their ideas about “the city” come from crime shows on TV, not any direct experience of their own. Seriously, quite a few of them consider urban environments in the USA to be foreign countries. Politicians in red states consider passenger rail service to be a communist, socialist plot, even now (look at how Wisconsin’s governor killed a high-speed rail project even when it meant shutting down a plant already being built in his state by a Spanish railway firm!).
Does this prove “people” don’t want to live in cities? No. It proves we’ve done a good job of using the continent’s resources as part of an employment program for sixty-plus years: we’ve not only employed people building extensive settlements from sea to sea, but used up lots of former farmland (which rising crop productivity and budding globalization was disemploying from crop production); we’ve employed lots of oil for fuel to move around (remember those suburban lots without sidewalks?); and we’ve employed lots of investment capital, building industries that commercialize activities that in an urban setting is handled in such a low key fashion as to escape notice. City people on their feet not only DON’T burn gas getting around, they don’t listen to radio deejays for their opinions as much — some of them actually talk to one another, on sidewalks or buses and trains. Contrary to libertarian theory, sometimes the most efficient methods are not commercial.
I don’t want to force anyone to live in a city who doesn’t want to; but I also don’t want anyone to chain me or anyone else to a suburb, either. Since cities are so efficient at using space, energy, and other resources, there is more than enough room for urban neighborhoods to be built in areas close to US metros’ downtowns; in fact, since so many of our downtowns are surrounded by asphalt moats of parking lots (seriously, check ’em out on your favorite mapping program), we could probably let gentrifiers spark substantial re-population next to downtowns without displacing hardly anyone; in fact, with the industrial depopulation we’ve already had from factories going overseas, there’s a lot of industrial land that can still be re-employed in the middle of most metro areas. What would help? A couple of moves in particular:
A. Build sidewalks. Especially in potentially gentrifying neighborhoods, ie, where residents ask for them.
B. Allow lots to be split in two, and houses to be built to two-plus stories; this might allow some landowners to get more money for their land, while keeping units affordable to the residents buying them.
C. Most of our long term economic development plans involve more schooling, both for younger and older adults. Chicago has formed something like its own “Left Bank” in the south Loop, with several colleges and universities setting up campuses in rehabbed high-rise office buildings. Any city with empty office buildings downtown could consider using one or more of them as a new campus. It’s cheaper than building new college buildings in the usual grass-moated style, soaks up a lot of downtown real estate in a heartbeat for a very long time, and re-introduces a bunch of students to the potential for living and working in an urban environment. Many of the jobs in information and knowledge-dominant industries don’t require a lot of space in a suburban industrial park — in fact, some work best in an urban environment. So why not start getting used to that environment now?
D. Understand rail travel as “expressways for pedestrians.” That isn’t meant as just a catchy phrase; I really mean that as a geographically defensible analysis. Expressways of any type are a means to get from one neighborhood to another, far distant. You don’t normally hop on the entrance ramp to get to the next neighborhood adjacent to yours — surface streets are fine for that, whether by foot, car or bus. People in autos use freeways or tollways to avoid stoplights and the other nuisances of local traffic. Same with people on foot: you need a way to avoid stoplights and slow traffic, even if you’re not driving yourself. The subway does just that. Sure, it goes that same place the bus would, but it gets there a heck of a lot faster. Subways and commuter rail do EXACTLY the same job freeways and tollways do, they just do it for people who don’t get into a car after locking their house door.
In the same fashion, high-speed intercity rail does the same job as air travel, at least for flights of less than, say, several hundred miles. Airlines that use a hub-and-spoke network of flights to feed passengers into a central “hub” airport could use rail to do the same thing. Until we figure out how to build maglev trains that can compete with hub-to-hub flights, hi-speed rail projects could concentrate on these in-region markets.
None of these would force anyone to live in cities, but they would start the process of building and living in higher-density neighborhoods more practical in the US context. Hi-speed rail won’t replace interstates and airports, but it will make high-density urban areas within our metros more viable and even productive, just as those interstates and airports do for the suburban regions of our metros. Both urban and suburban regions deserve infrastructural support appropriate to their realities, and they both should pay their own way with financing schemes that fit their situations. They both have a place in our economy and society. Neither needs to get in the way of the other, and neither should be allowed to. And both should be expected to environmentally sustainable, which is just another way of saying they should responsible and built for the long-haul.
Wow! That comment has to be a record for both length and thoughtfulness. Thanks for the insights.
You talk a lot about transportation. I have an issue with the way transportation projects are funded in this country. I’d like to see gasoline taxes 100% used to fund road construction and maintenance and nothing else. I’d like to see road projects completely funded by gasoline taxes. I’d also like to see mass transit 100% paid for by the people who use it in the form of higher fares. Whenever resources are allocated on any basis other than usage you get a serious misallocation.
I’m not a fan of high speed rail. I don’t think riders are willing to pay for it and therefore the cost will exceed the value. However, I think we need to get freight off the roads. What a waste. Check out the Dan Ryan whenever traffic is bad (usually) and it’s all trucks. We need a serious overhaul of the freight rail system. I hear the Chicago hub in particular is a huge national problem. And putting freight on rail is a lot cheaper (no comfortable coaches required) than putting people on rail. And freight is a little more forgiving of hiccups than people.
I lived within the Chicago city limits for my first 35 years. Then to Elmhurst and now, 20 years later, out to Yorkville (you’ll have to look it up). Being in the graphics industry, I feel I’m still chained to Chicago for work. If I can break that chain, I’d move even further away.
Too many people, too much noise. Living stacked up on top of each other on 25 X 125 foot lots has long lost it’s appeal. Long time ago I studied architecture and land planning. Plans were developed a long time ago to build self sustaining small communities, basically small towns. Surrounded by green. Much quieter. Higher quality of living based on not going insane from being around too many people and too much noise.
I hear you. I think with telecommuting the value of a city for work is declining fast. In fact, I hate offices. I think they sap your productivity with a lot of distractions. Most real estate agents work from their homes and cars and can work together like they are next door to each other.